
TSZONES: where price fights happen
TSZONES automatically locates and draws at 14:30 (Spain time) the trading and contract auction zones: areas where the market tends to concentrate real order matching, absorb liquidity, and make it clear who’s in control.
These zones aren’t a “pretty line.” They’re the price block where you typically see the most aggressive activity. And here’s the key: when price pushes through those zones, it usually means that block has been bought or sold by smart money (liquidity gets consumed) and the market shifts from auctioning to displacing, often triggering a fast expansion.
What TSZONES gives you
TSZONES is designed to give you a clear trading framework during sessions when price “gets serious.” Its goal is very simple: mark the area where real trading happens and help you identify the moment the market stops “working” and starts moving.
-
Trading and auction zones
It detects the area where price tends to concentrate contract matching. That’s where the real “fight” happens: absorption, defense, and control being taken.
-
Aggressiveness read
These zones mark where trading is more likely to turn aggressive: where large orders step in and where price often reacts hard.
-
Expansion after breaking the zone
When the zone gets taken out, it often means the block has been consumed (bought/sold), and the market enters displacement mode: faster, cleaner moves.
-
Context for entries and management
TSZONES acts as a context map: it helps you avoid chasing price and understand where it makes sense to look for decision, continuation, or rejection.
Important: TSZONES is a reading and context tool. It does not promise results. The market changes—news happens, and some days are “messy.” Use it to understand where institutional activity is more likely and to trade with controlled risk.
Demo video
Watch the video and you’ll see how the zones are drawn and how the break is interpreted to look for expansion.
Real TSZONES example
Real screenshot of the indicator with the zones drawn. Click to zoom in.
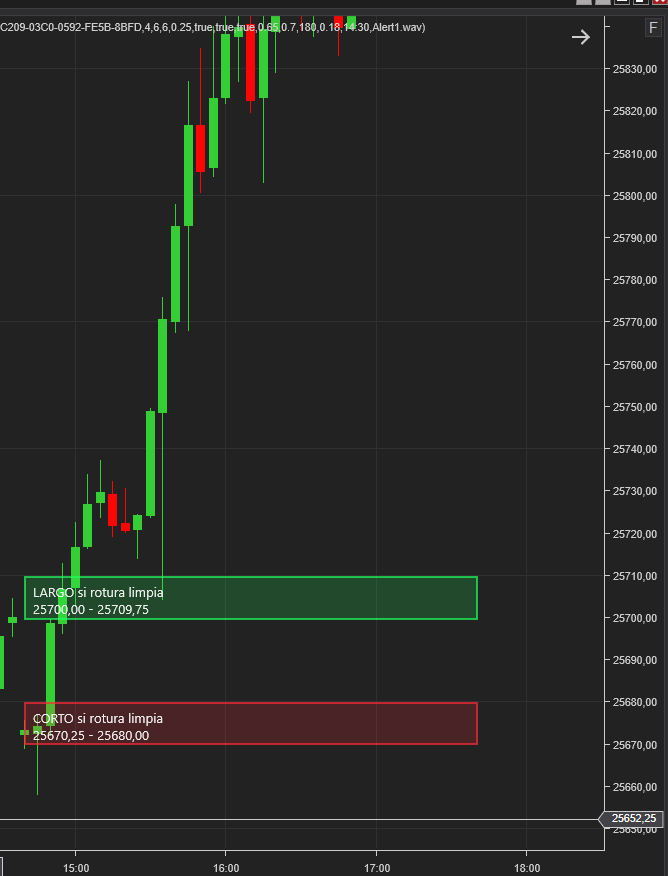
Recent performance
In the session shown, these are the zones drawn as of 01/26/2026, and the module is reporting a win rate above 80% (based on the expansion criteria defined by the system).